Wingify DevFest 2018: a data selfie, emotion detection and a rocket regression
Wingify DevFest 2018, session by session: a keynote, Google Cloud on AI, a data selfie, emotion detection, distributed deep learning, NLP for Indic languages and a Kaggle rocket problem.
 Jatin Kumar Malik First published on
 X
So, two weeks back I spent my Saturday at Wingify DevFest 2018 and came home with a hand-drawn “data selfie”. It was Wingify’s second DevFest, held at their office in Netaji Subhash Place on 1 December, and this year’s theme was Data Science and Engineering. The day ran from 10:30 in the morning to 6:30 in the evening, and we were asked to bring laptops. Here’s how it went, session by session.
Wingify and I go back a bit
In January 2014, in my final semester, I missed their overnight hackathon by a day and wrote to their careers address at about 2 am, with the subject line “DAMN ! I missed the Overnight Hackathon ! :(”. In February 2017 I pointed out to their engineering account on Twitter that a page of theirs used ”</>” for the Prev/Next buttons, and linked a way to make chevrons in pure CSS. (Yes, I am that guy.) So walking into their office for DevFest 2018 on 1 December was fun.
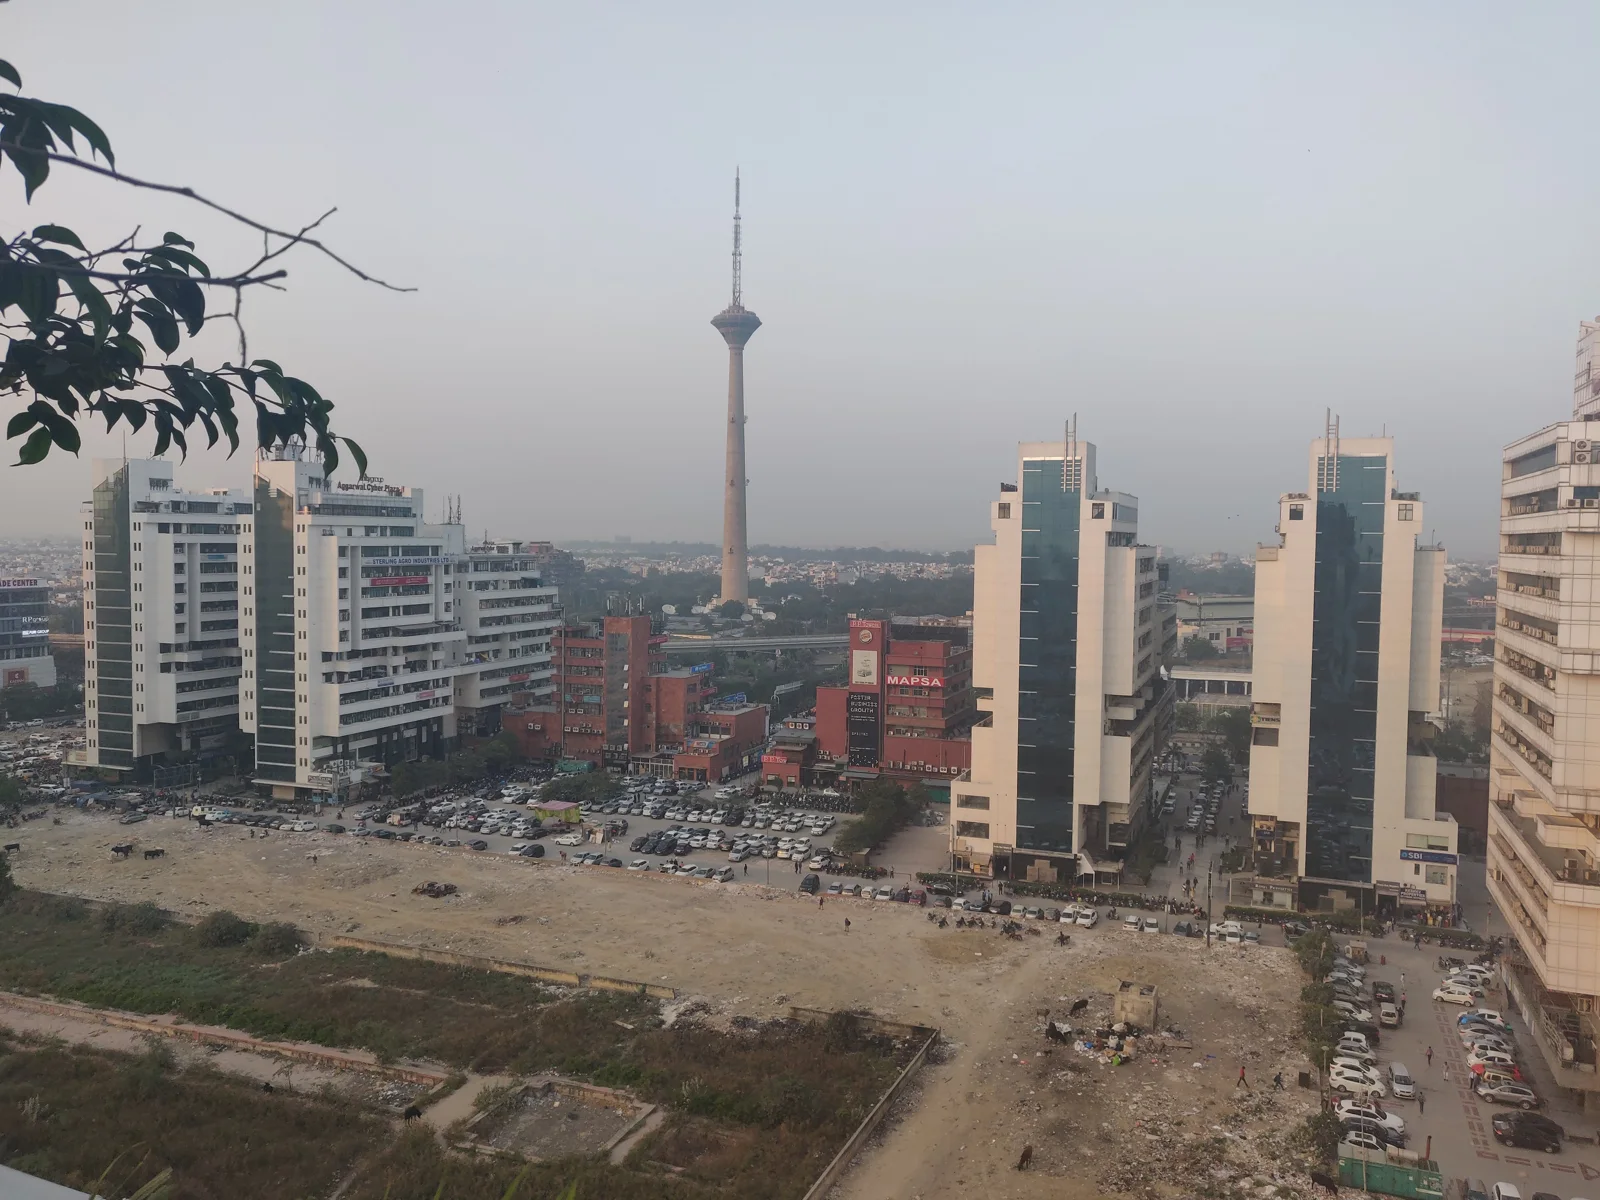
And the office has a view! That’s the TV tower, from their floor:
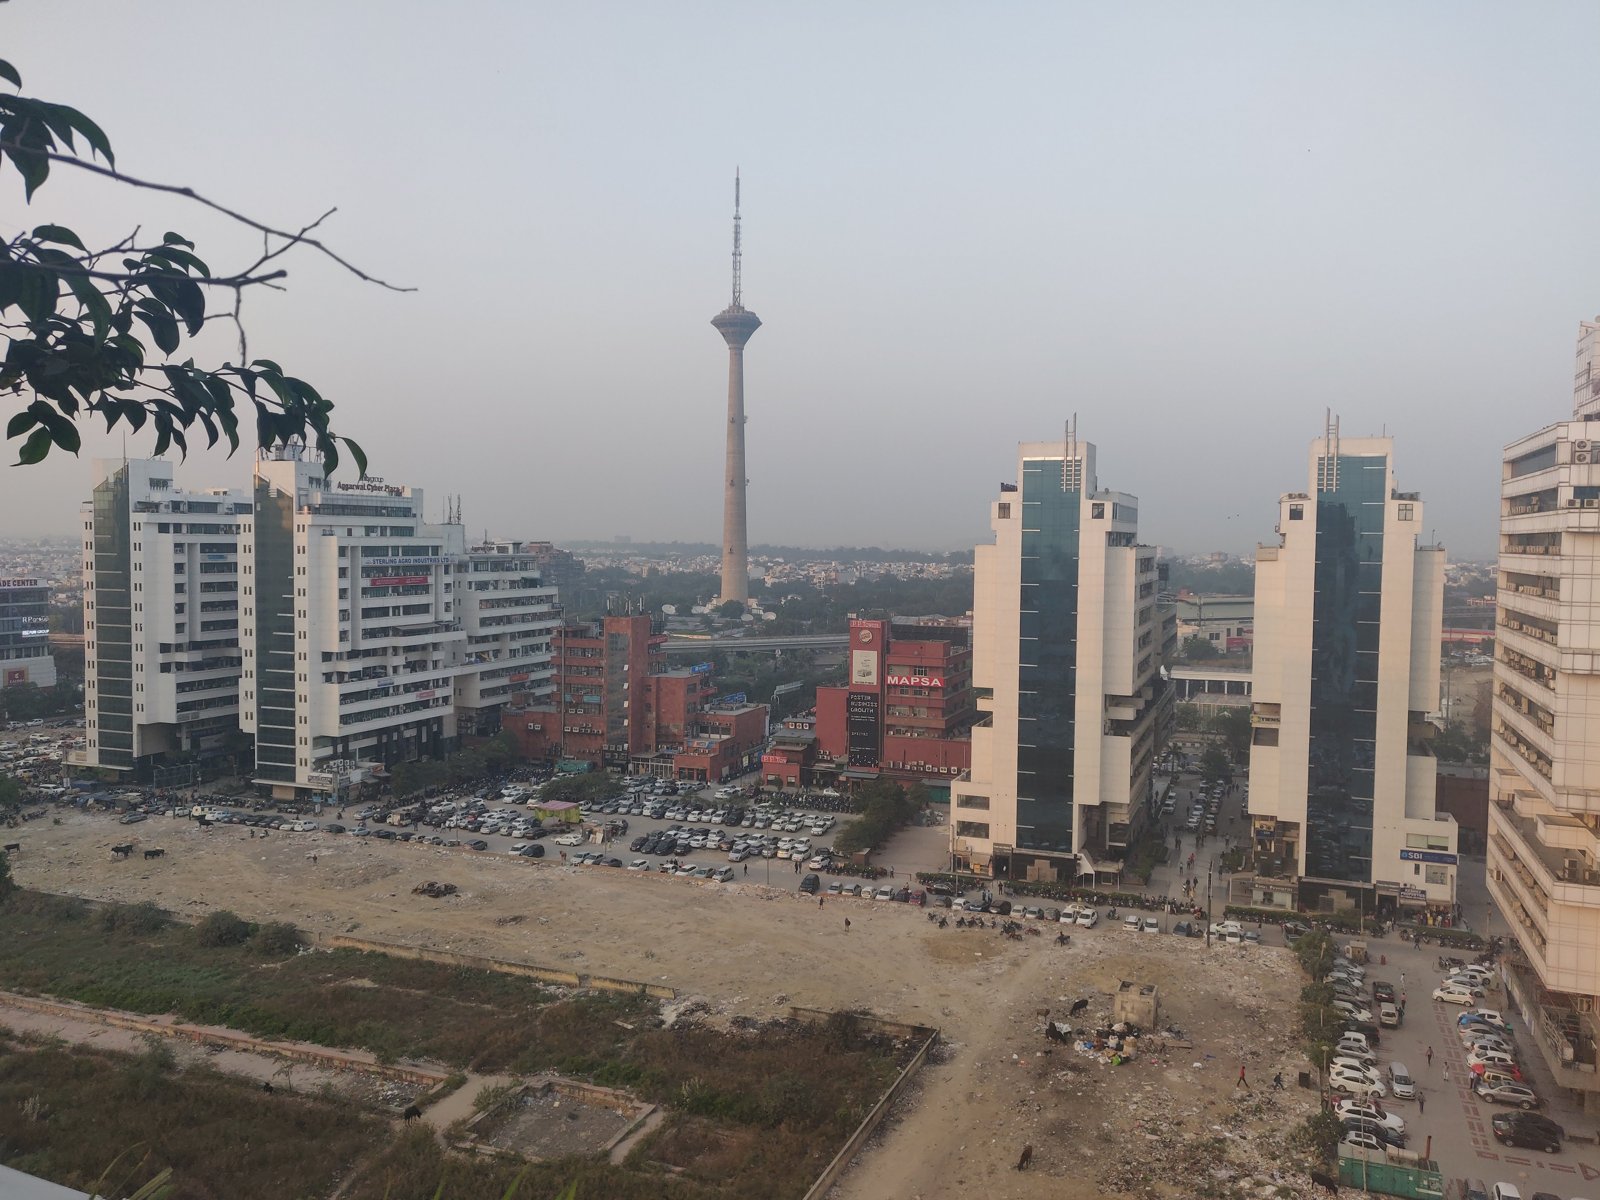 The view from Wingify’s office.
The morning: a keynote and Google Cloud
Registration opened at 10:30. The day started at 11 with a keynote by Paras Chopra, Wingify’s founder. After that came “Making AI work for your Business” by Rishi Singhal, a customer engineer at Google Cloud Platform, and then a short tea break.
Hands-on 1: making art with data
The first hands-on session was “Beyond charts & numbers: Making art with data” by Rasagy Sharma, a designer and data artist.
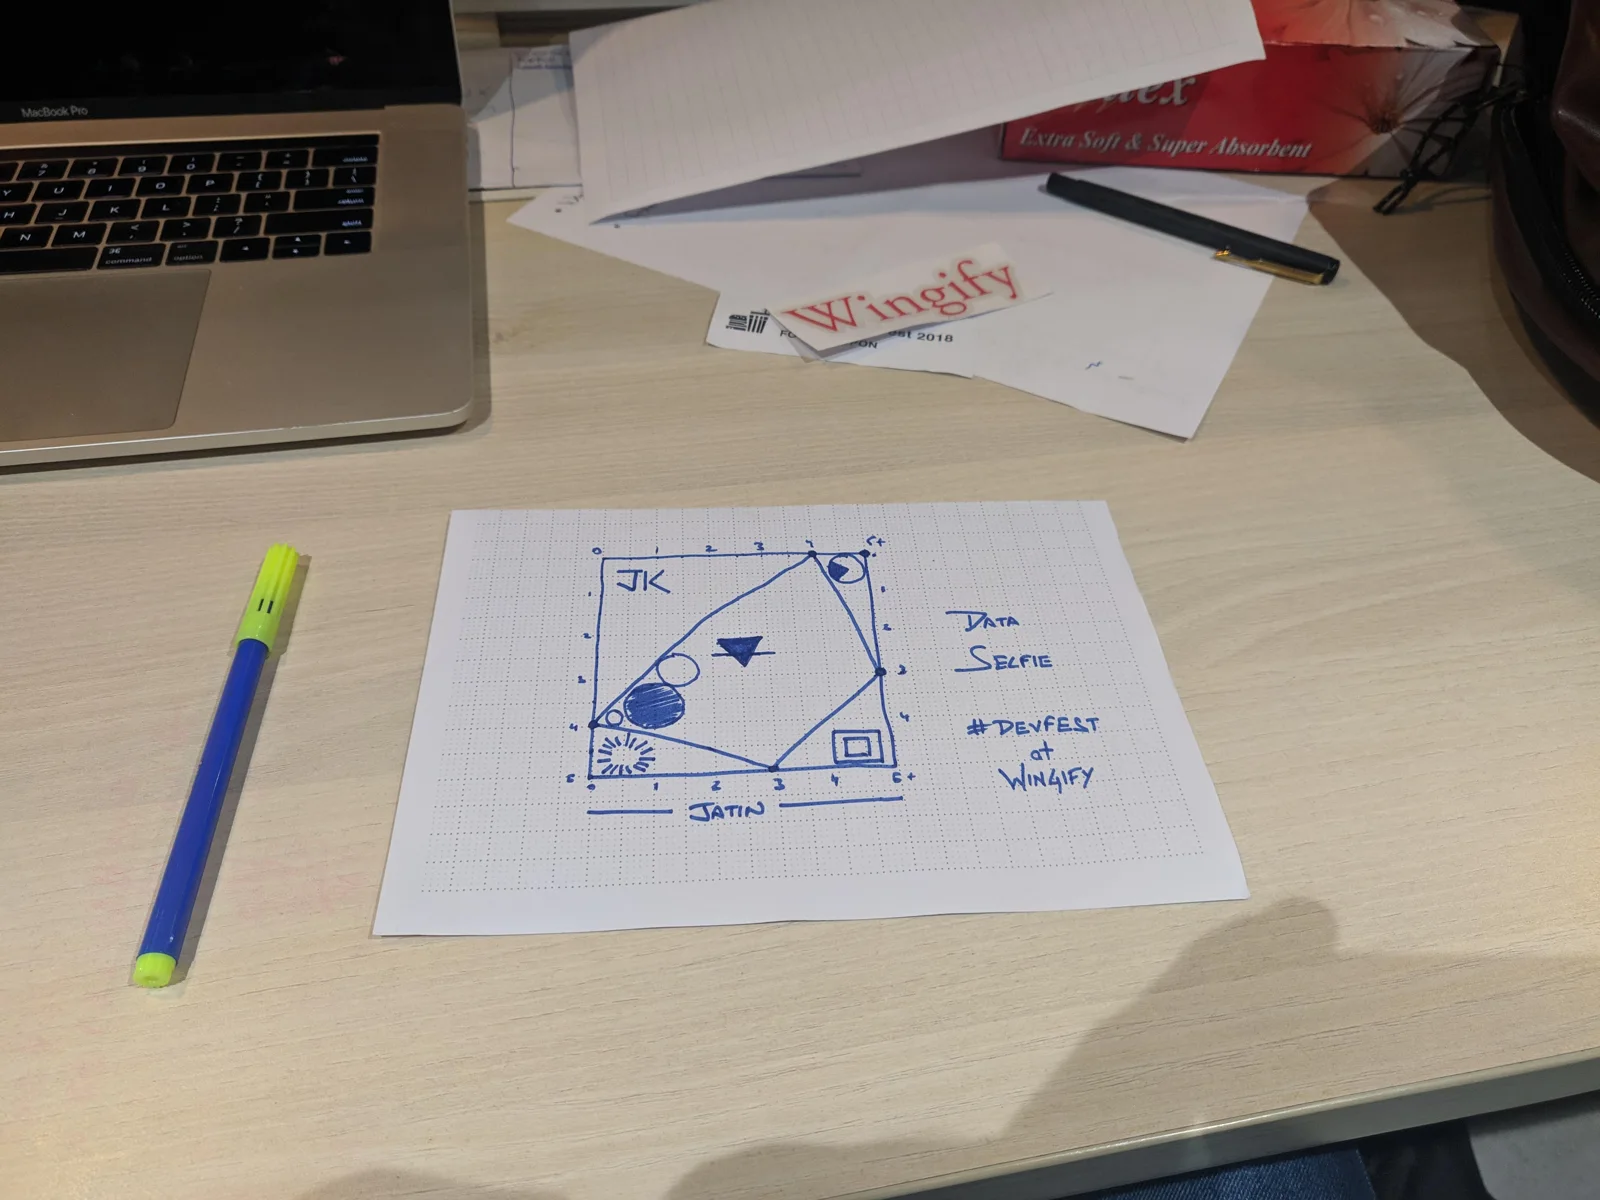
This was the session I tweeted about. It was on data visualisation, and in it we each drew a “data selfie”. Mine is on dotted paper in blue pen: a five-by-five grid with “JK” in the corner and “Jatin” under the x-axis, a big four-sided shape joining points on the edges, circles of different sizes, a filled triangle, a little sunburst and a square inside a square. My verdict that afternoon: “What an amazing session about data visualisation! 🔥”
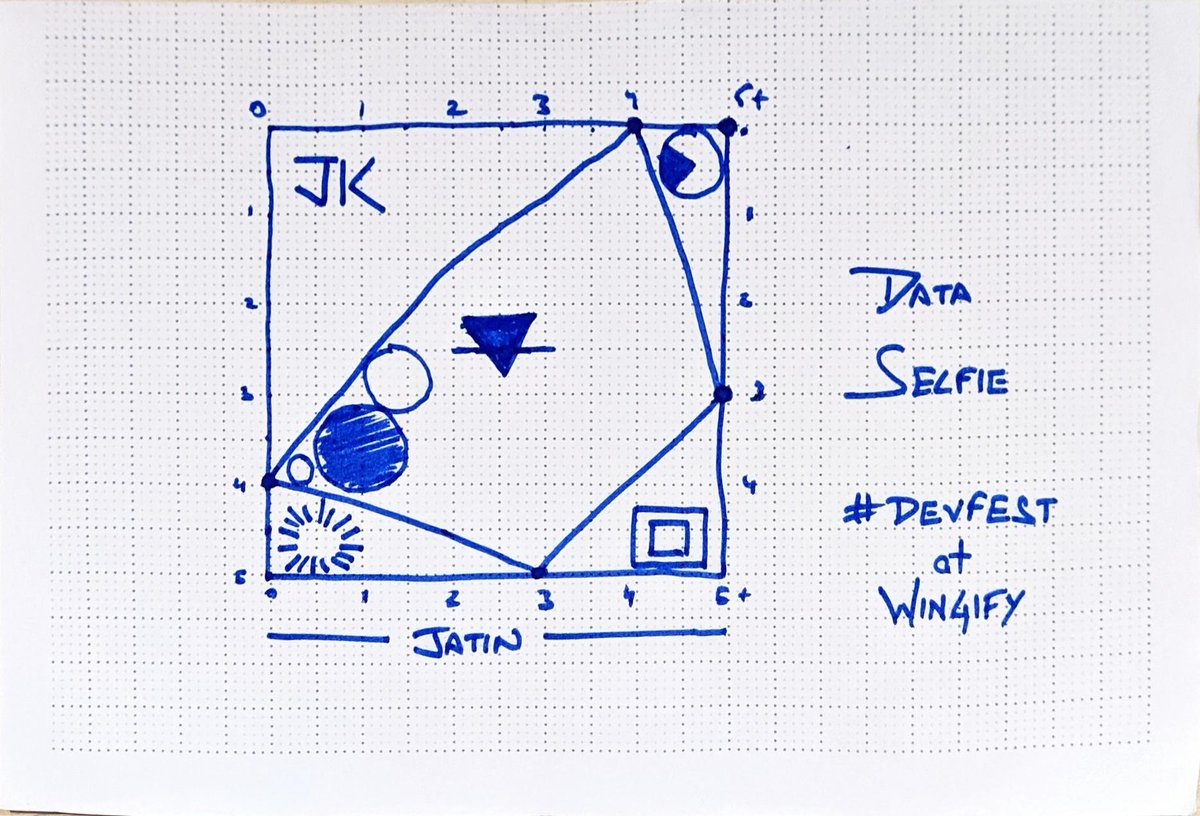 My data selfie from DevFest 2018 at Wingify.
The exercise was inspired by Giorgia Lupi’s TED data selfie (Rasagy’s thread has more from the room). Every shape answers a question, a mix of developer ones (years as a dev, languages, cities, Mac, Windows or Linux) and fun ones (when you wake up and start working, what success means to you, where to find you on a typical weekend). Which shape is which on mine, I’ll leave as a puzzle. :P
After lunch: can a machine read emotions?
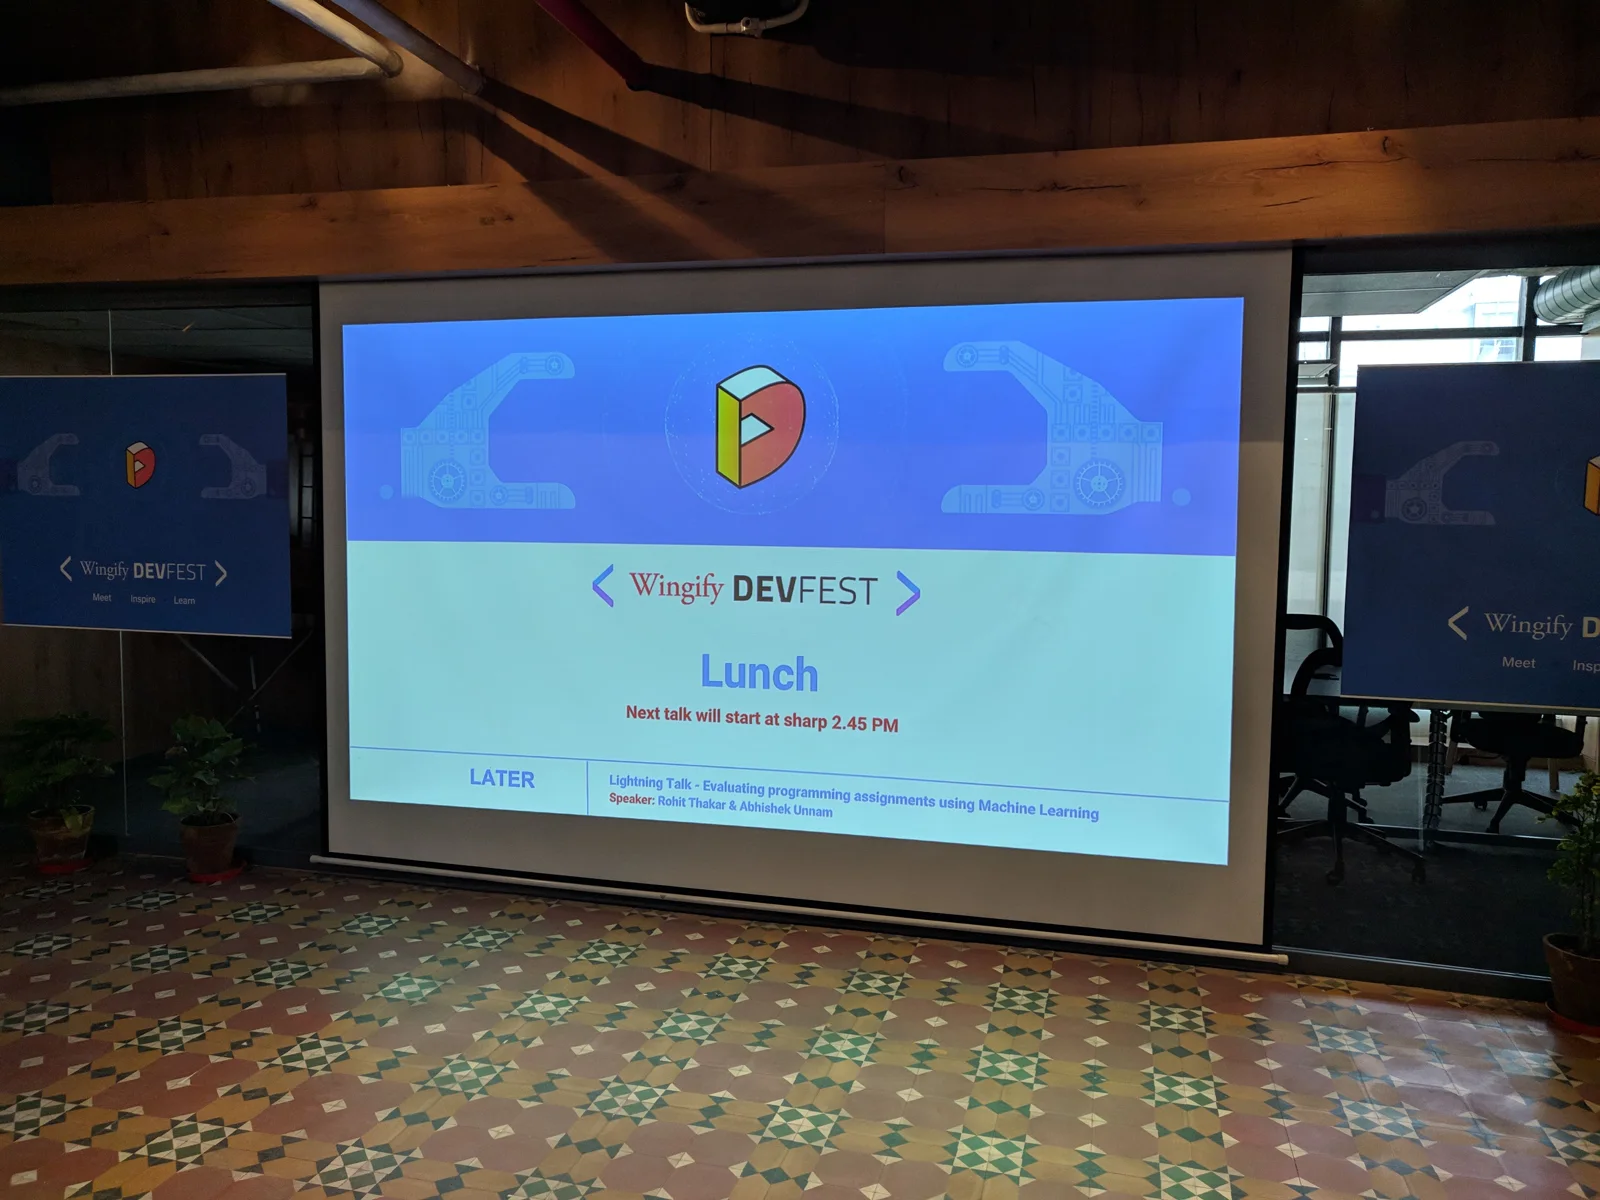
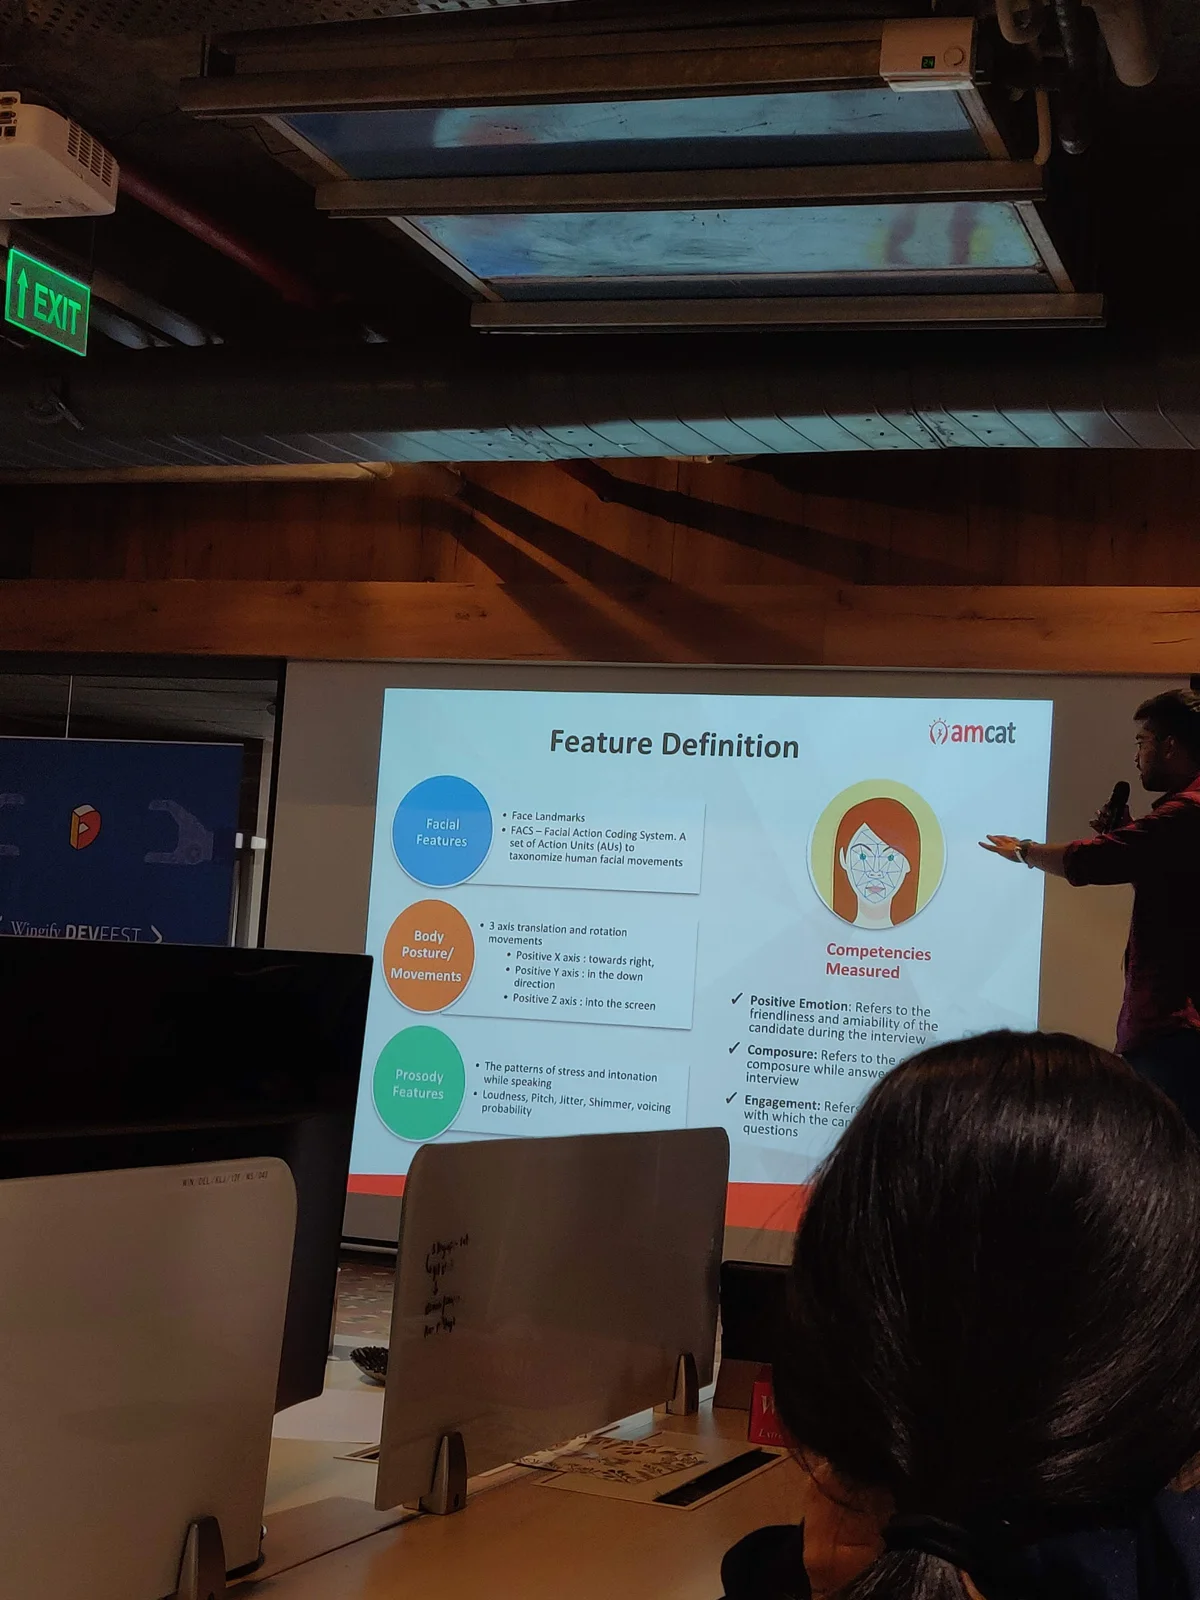
The slide on the big screen said lunch, and that the next talk would start at sharp 2:45 PM. It was the lightning talk by Rohit Takhar and Abhishek Unnam, research engineers at Aspiring Minds. The schedule had it down as “Evaluating programming assignments using machine learning”. The title slide they actually put up was “Evaluating human emotions using machine learning”, so it was about detecting emotions automatically.
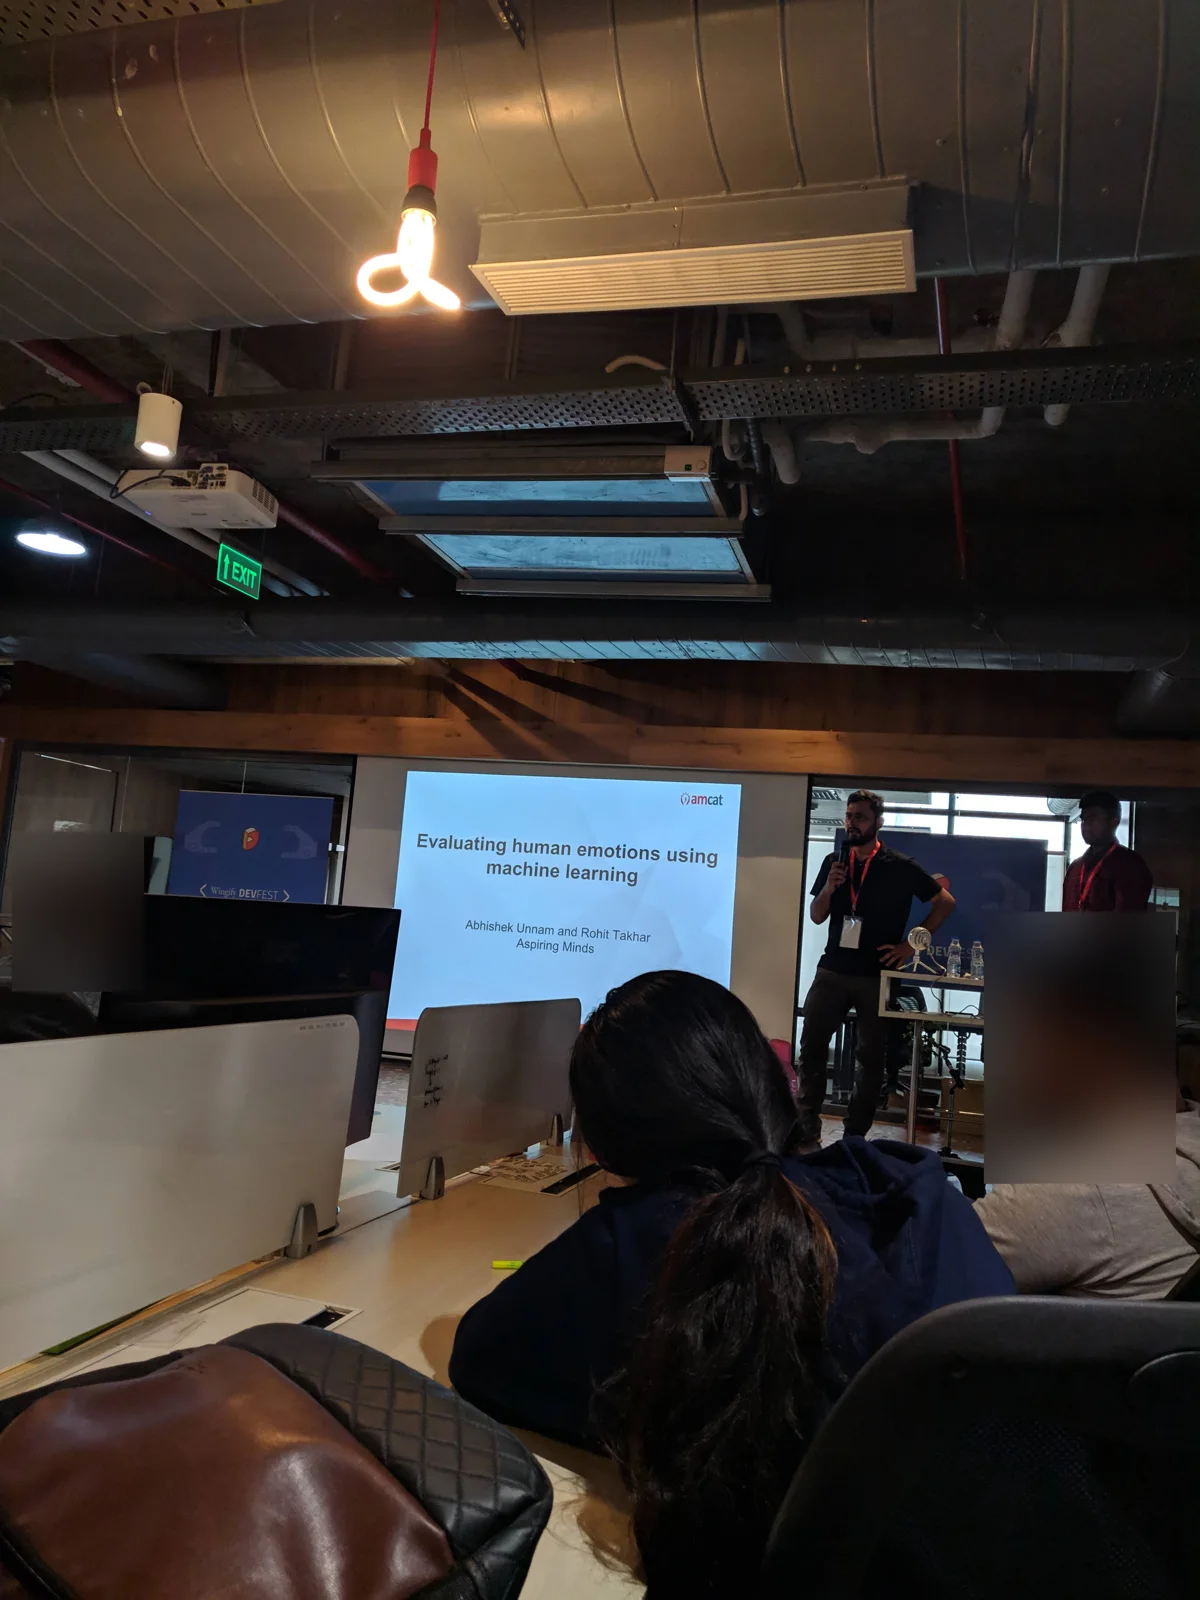 The lightning talk, right after lunch.
Distributed deep learning, then NLP for Indic languages
Two talks filled the afternoon.
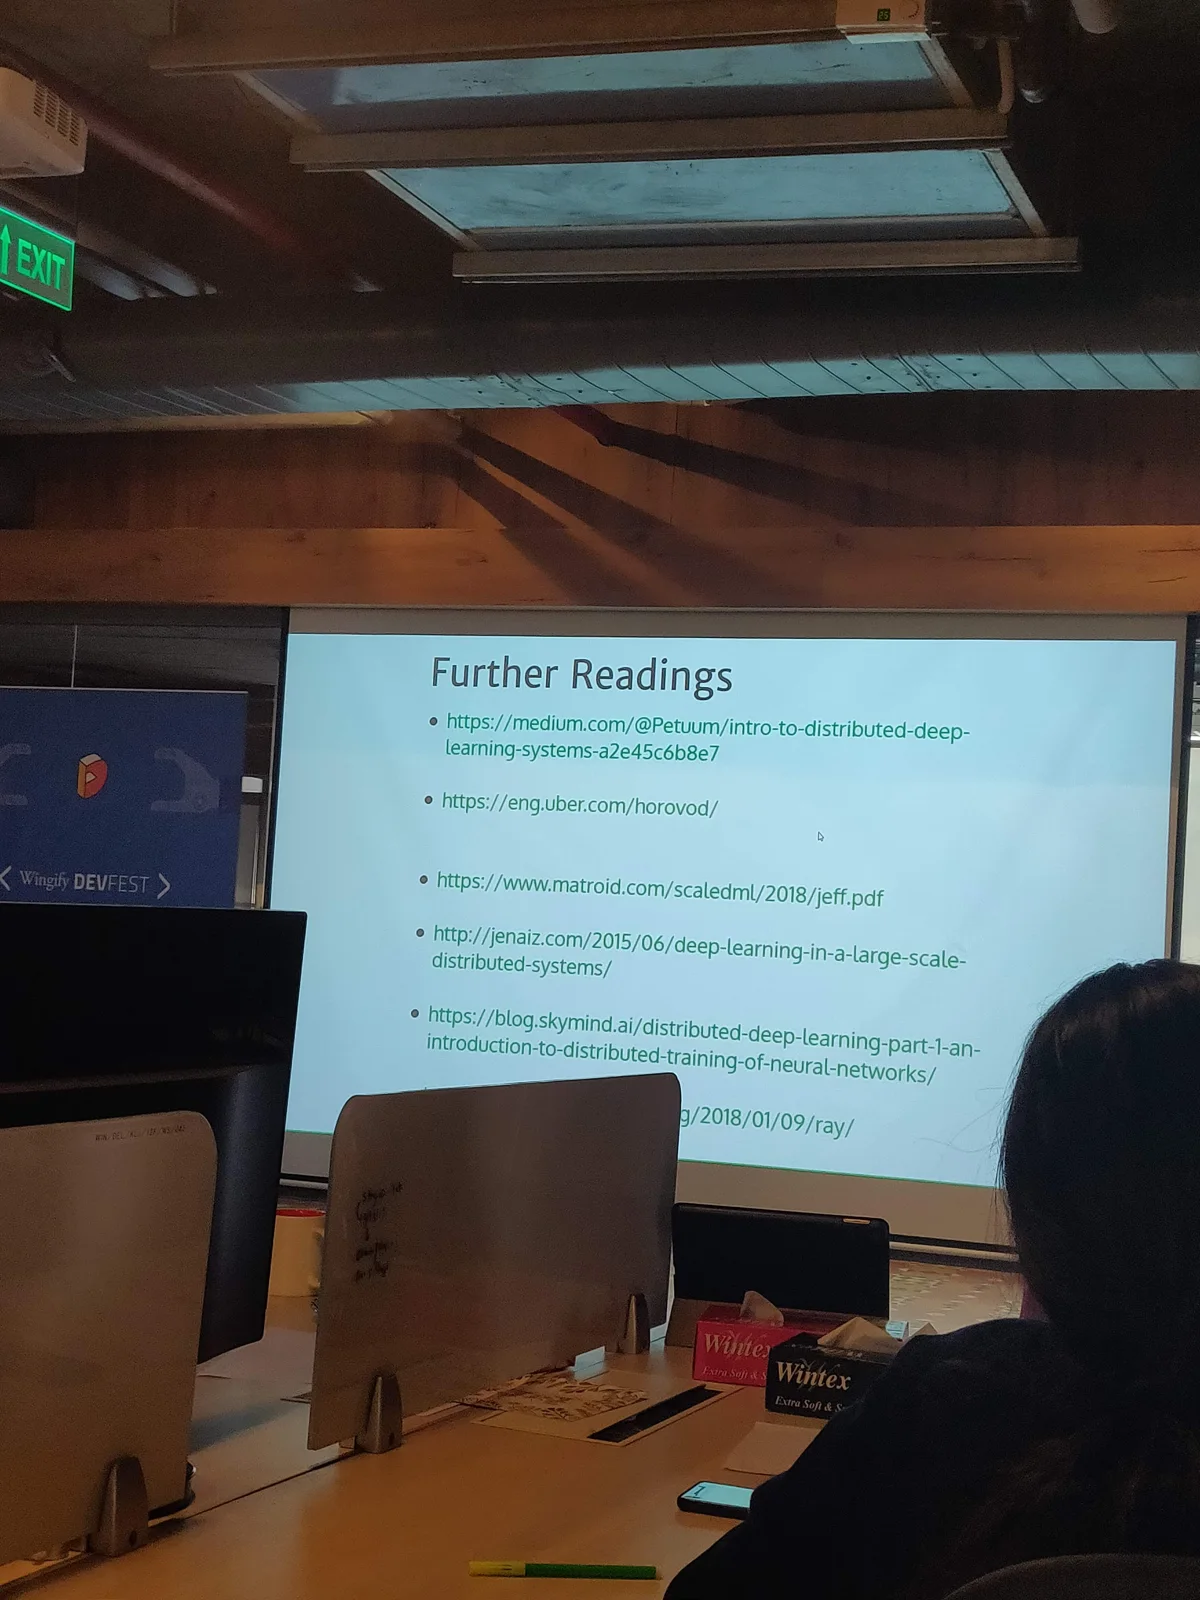
First, “Distributed System In Deep Learning Machine” by Ashutosh Singh. I took a photo of the further readings slide at the end, which pointed to intros to distributed deep learning systems and to Horovod.
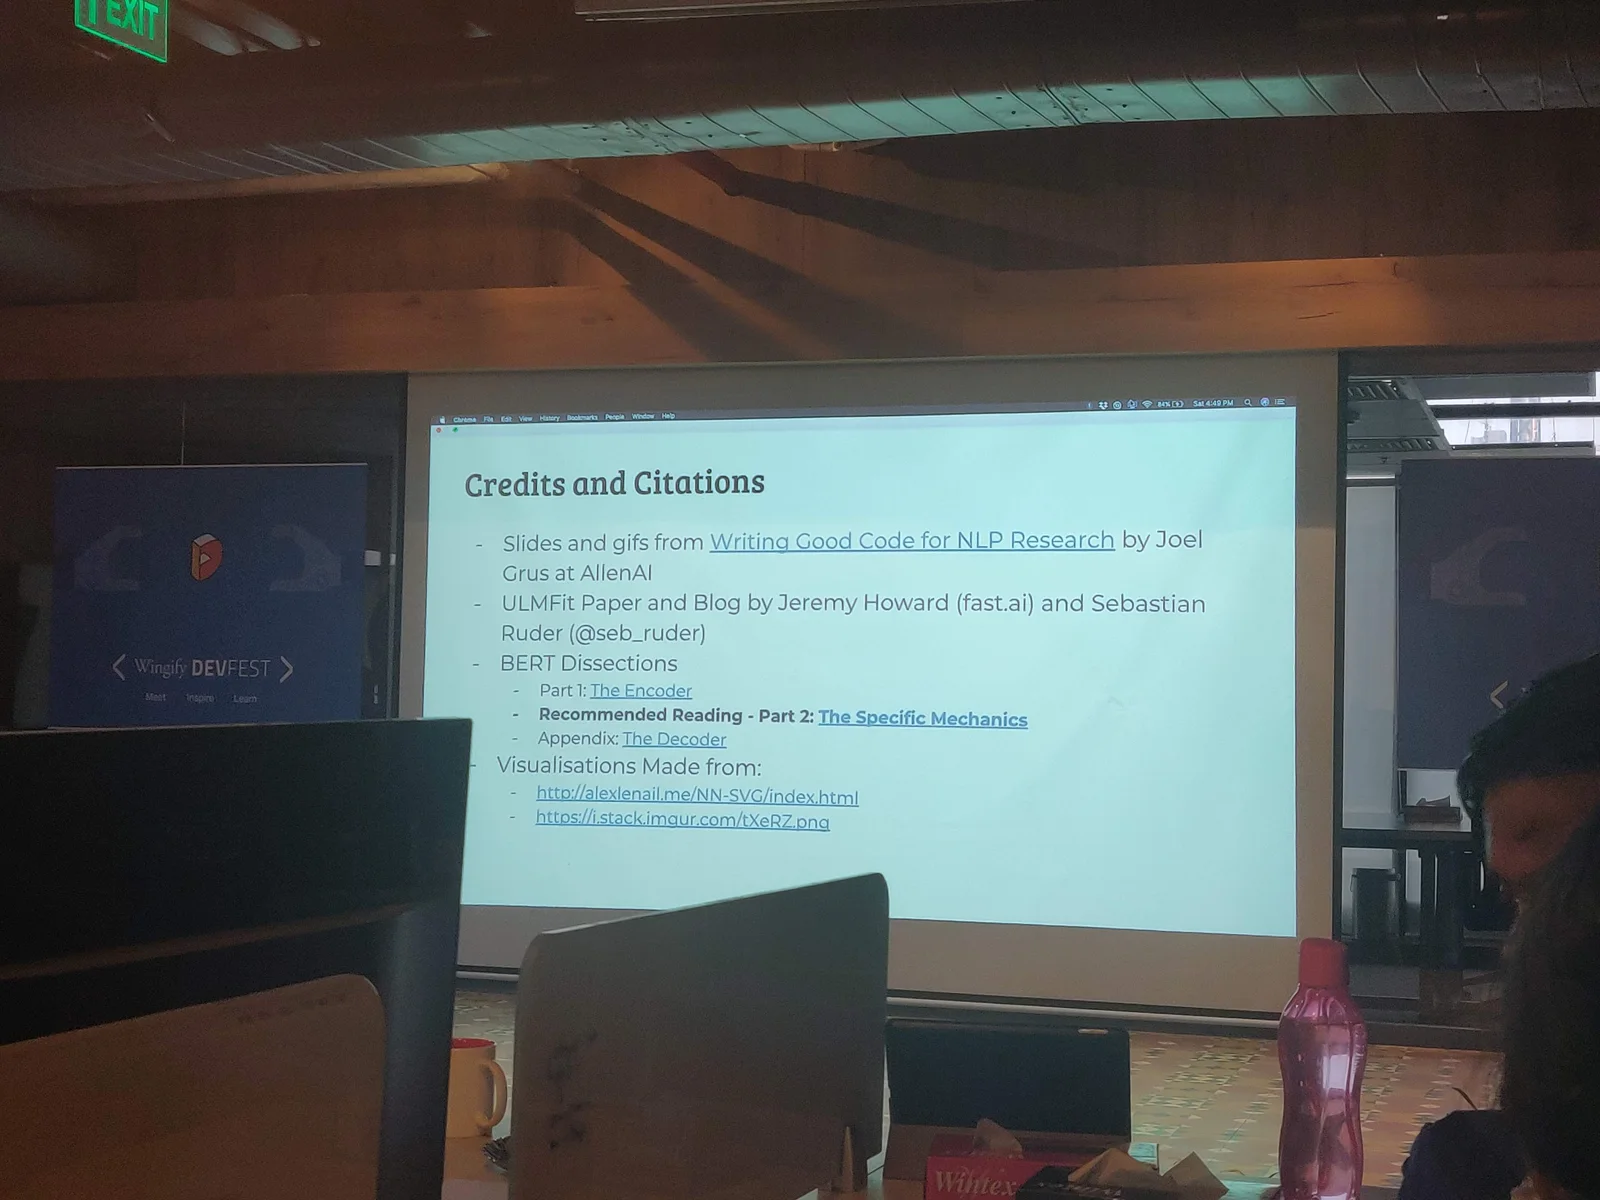
Then “NLP for Indic Languages” by Nirant Kasliwal. It opened with a “What you’ll learn today” slide that began with “There are too many NLP challenges in any language!”, and the credits at the end cited Writing Good Code for NLP Research by Joel Grus, the ULMFiT paper and a set of BERT dissections.
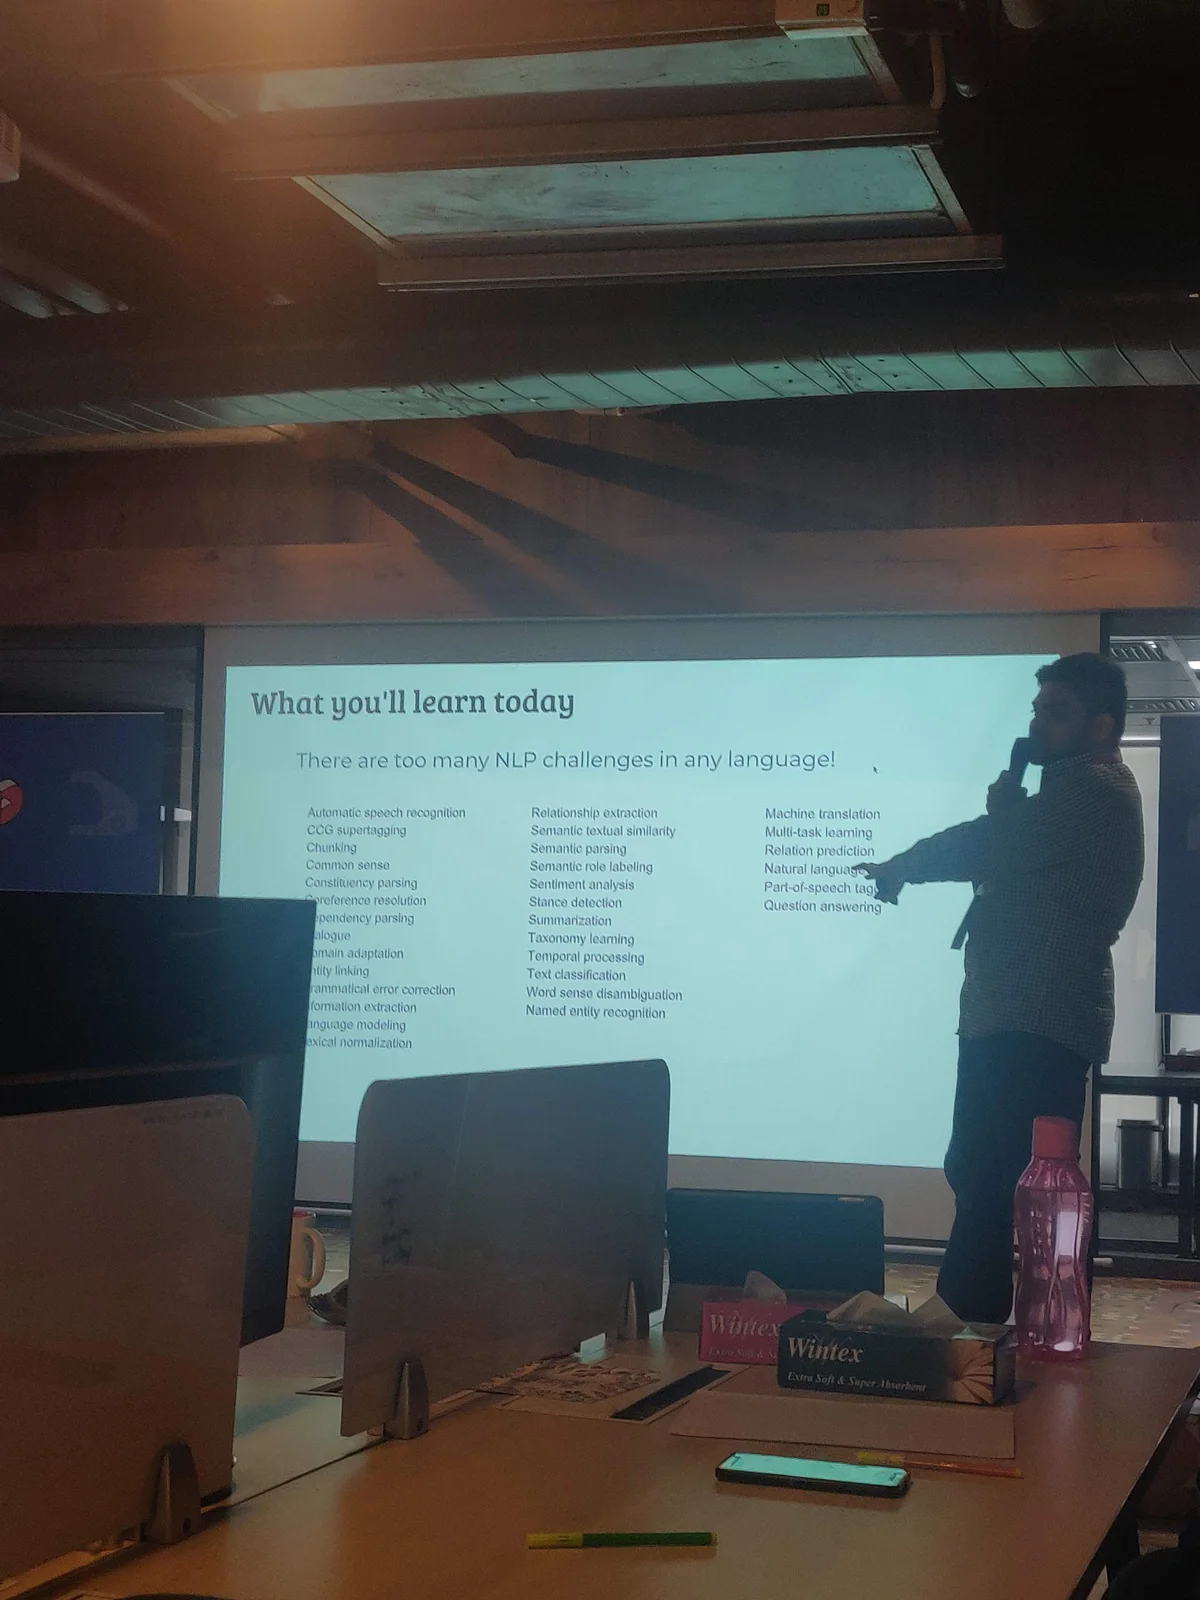 The start of the NLP talk.
Hands-on 2: the rocket velocity challenge
The last slot of the day, from 4:45, was a data science competition on Kaggle. The first problem was called “Zoom !! The Rocket Velocity Challenge”.
My notebook for it is a Colab called Wingify_devfest_p1. It loads four CSVs for a “rocket” dataset (7,978 training rows, with internal friction, fluid force and propulsion force as the three features), splits them 80/20, and tries two models. Plain linear regression gave a mean squared error of about 15,559. Ouch. A random forest with 1,000 trees brought it down to about 44.5. Much better! The last cell submits the predictions to a Kaggle competition called devfestq1, “Submission by Jatin K Malik”.
All my photos from the day
The day after, I pinged Wingify on Twitter: “folks, what about the photos @ #devfest2018?” Till then, these are mine. :)
Keep reading
Post[0] = "why tech?"
I always talk about how I am a huge nerd when it comes to tech. So, what better way to start my engineering blog than talking about "why tech?".
Leaving Adobe, my dream company, without an offer in hand
Nearly three years at Adobe, my dream company. Then a farewell mail on 3 April 2017, no offer in hand, and a few months later the gig I wanted.
Millionaire by 12? The WhiteHat Jr ad and India's pressure culture
A WhiteHat Jr ad promising 'CEO at Age 13' got me ranting about a childhood where Maths beat Music, and an engineering batch that mostly did B.Tech for the prestige or because they 'had' to.
Leave a comment