Zion, part 3: a dashboard that says 'All good' and a 2015 tablet on the wall
Why I wrote my own homelab dashboard in stdlib Python, and what it took to keep a 2015 Fire 7 on LineageOS showing it on the wall 24/7.

Zion runs about 40 containers now, and any of them can break without me noticing. I wanted one screen I could glance at from across the room that either says “All good” or tells me exactly what’s wrong. This part is about that screen, and about the 2015 Fire 7 that shows it on my wall, which turned out to be the harder half lol.
Why not Homepage
I started with Homepage like everyone does, but it’s a launcher. It won’t tell me the last scrub was too long ago or that a SMART counter just went up. Grafana means Prometheus plus a pile of dashboards-as-code. Uptime Kuma (which I do run) only knows up or down.
So I wrote my own: about 700 lines of Python using only the standard library, plus plain JS and CSS, with no framework and no build step. The container sits at around 26 MiB of RAM.
A few weeks later I retired Homepage completely. It was two containers and ~120 MB of RAM for a second list of links I had to keep in sync. The bare zion.<mydomain> now redirects to the dash.
Where the data comes from
- Netdata, every 5 seconds: CPU (total and per thread), RAM, load, temps, network, disk IO and stall time.
- The Docker API through a read-only socket proxy. It can list containers and that’s it, any POST gets a 403.
- Health checks against every app’s own local port every 15 seconds. An app only counts as down after two failures in a row.
- vnStat for daily and monthly bandwidth.
- A root collector on a systemd timer every 30 seconds, for the stuff a container shouldn’t be allowed to touch: pool status, scrub and snapshot age, SMART, systemd units, Tailscale, pending updates, and both Surfshark tunnels (it hops into each Gluetun container’s network namespace to check them).
The server turns all of that into one verdict plus a list of problems, and the page just polls it every 5 seconds and draws it. All the logic lives on the server so the page stays dumb, which paid off later when it had to run on a tablet with under 1 GB of RAM.
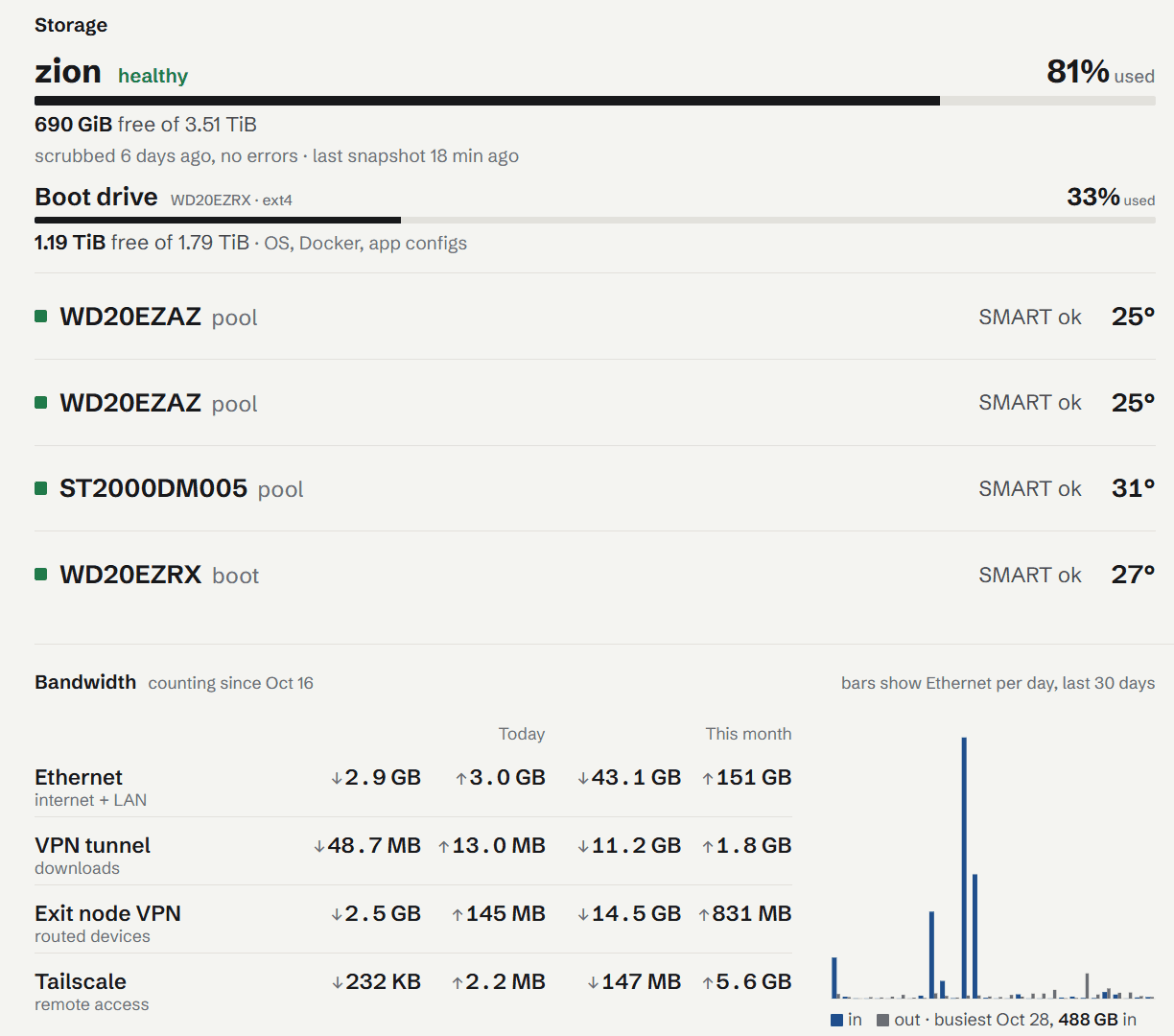 Storage and bandwidth: the pool and SMART lines come from the root collector, the traffic from vnStat.
What turns it amber or red
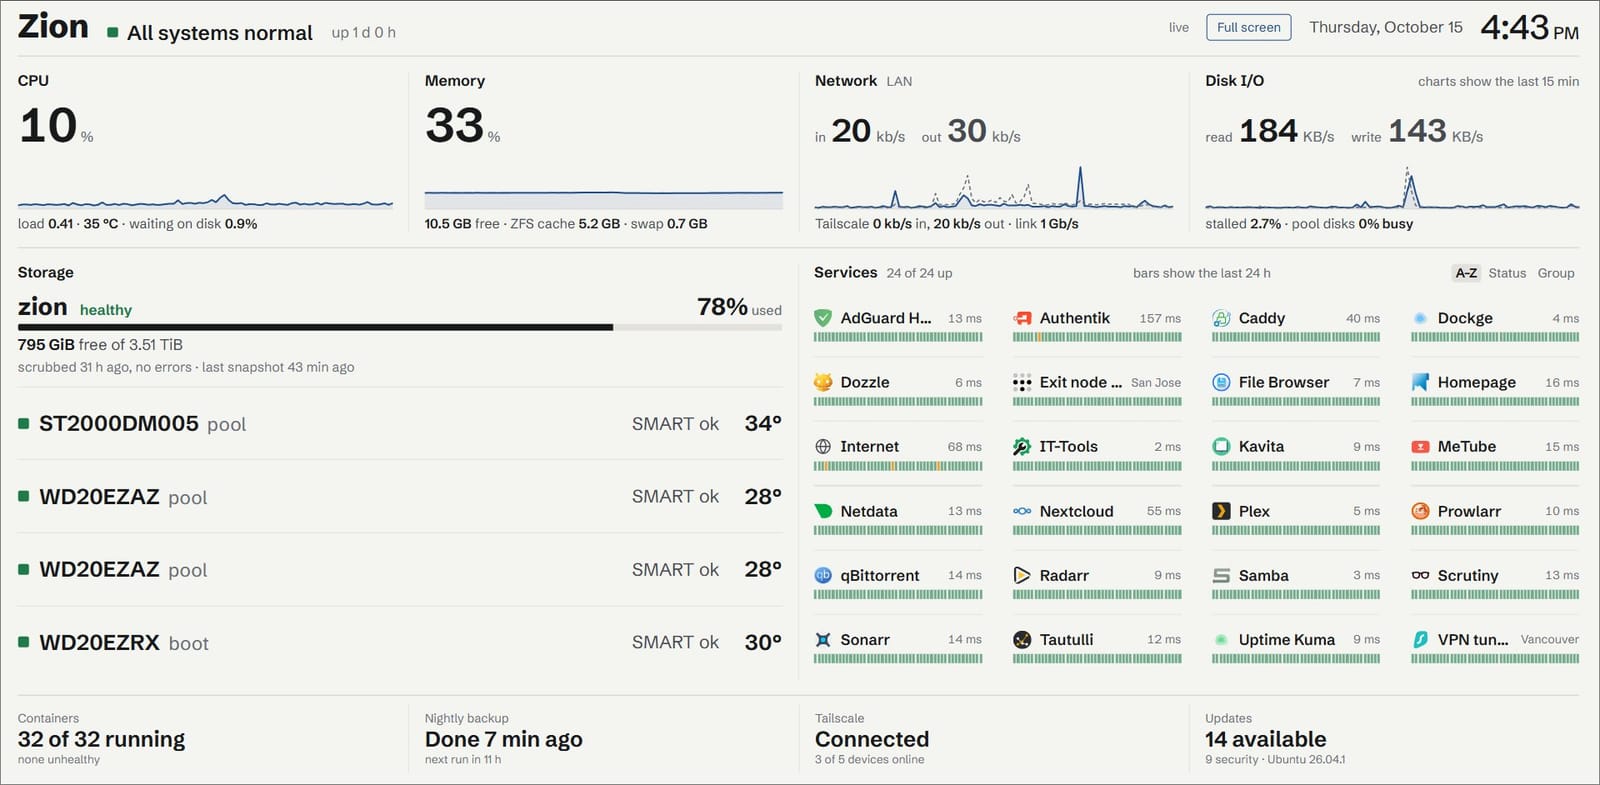
That’s from day two, when Homepage still had a tile. The thresholds live in one config.json as warn and crit pairs: CPU, memory, swap, temps, pool capacity (amber at 85%, red at 90%), scrub and snapshot age, cert expiry, backups older than 26 hours, the off-site upload older than 8 days. On top of those it flags pool errors, SMART, apps failing their checks, failed systemd units and stopped containers. When anything’s wrong the header turns into a solid ochre or red band with the problems listed under it.
SMART needed a trick. The Seagate in the old pool has 1480 CRC errors on its lifetime counter from old cable trouble, and those counters live in the drive firmware, so you can’t reset them. The first version sat on amber forever. Now config.json holds a baseline (what every counter read on Oct 14) and it only alerts when a counter climbs above it.
The VPN check is my favourite. For each tunnel the collector checks that the container is running, the tunnel is up, it can actually reach the internet, and which city it exits from. Then it compares the tunnel’s public IP with my home IP. If they match, the dash goes red with “LEAK: traffic leaves from the home IP”.
Every app tile has a strip of bars, one per 30 minutes over the last 24 hours, so if something was flaky at 3am I can see it even when it’s green now.
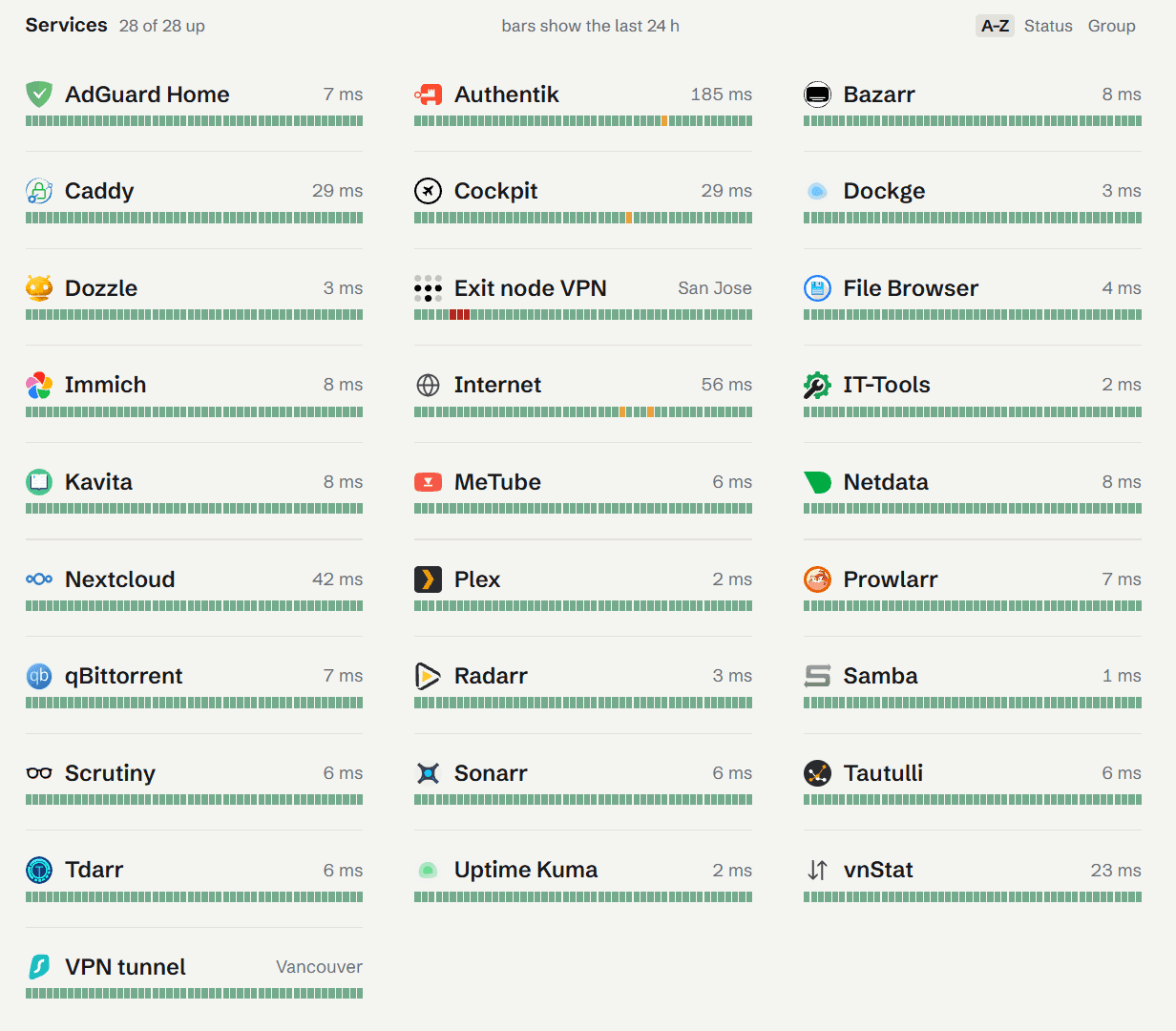 The app tiles. The amber and red bars are blips from the last 24 hours.
Design stuff I didn’t expect to care about
The first version was the classic dark neon homelab look and I had it redone the same day. Now it’s a light “paper” sheet with one blue accent for charts and status colours only for status. No glows, no pulsing dots, and it always fits one screen.
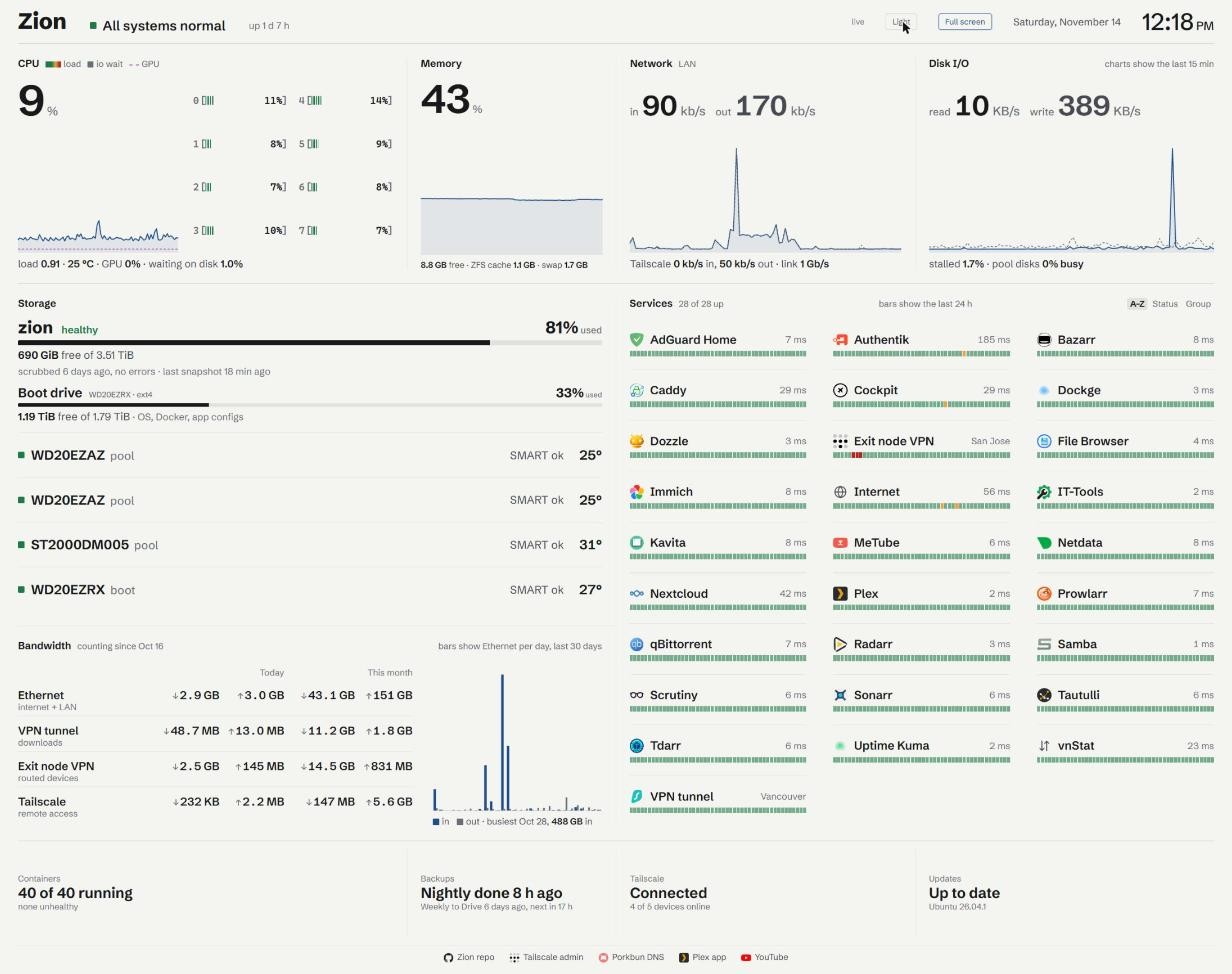 The paper version.
The CPU panel took three tries. Thin lines for all 8 threads were too faint. Then 8 bars next to the big number, which I didn’t like. Then htop style, one 0[|||||| 45%] meter per thread coloured green to amber to red like btop. That one stuck.
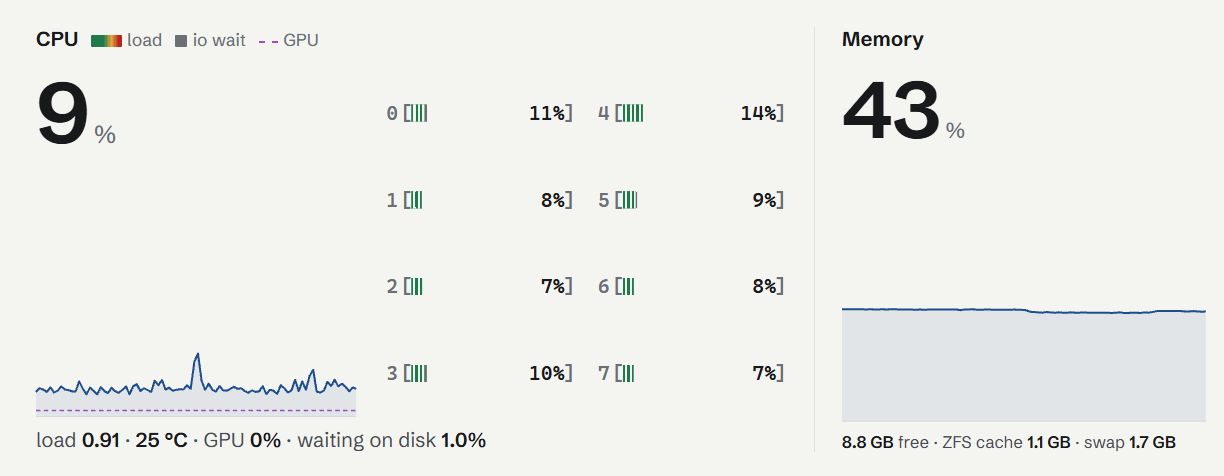 htop-style meters, one per thread.
During an IO storm, Netdata’s sensor plugin died and the temperature chart started returning 404. The dash fetched all vitals in one request, so that one 404 blanked CPU, memory, network and disk. Now a missing temperature only drops the temperature.
The wall view
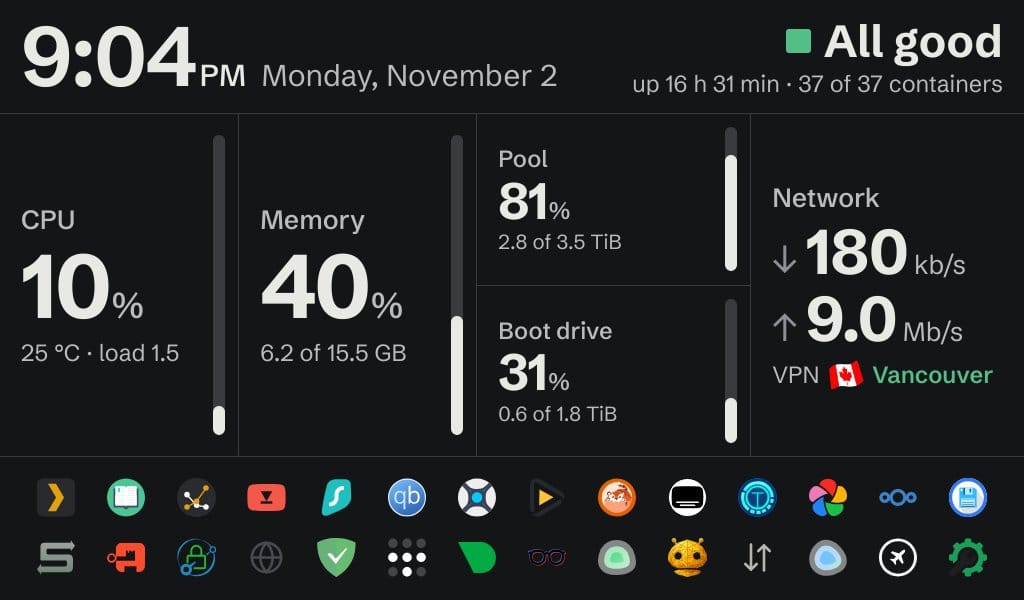
The tablet is a 2015 Fire 7 running LineageOS 14.1 (Android 7.1) with 887 MB of RAM 💀 On its 1024x600 screen the full dash had to be read up close, so it got its own page on top of the same data: clock, verdict, big CPU and memory numbers with a level gauge, pool and boot drive in one split tile, network rates with the VPN exit’s flag and city, and every app as an icon. Slow apps get a yellow outline, down ones go red and grey. Numbers turn white, yellow or red on the current value, so a CPU spike shows from across the room. If the data goes stale it says “Zion not answering” in red.
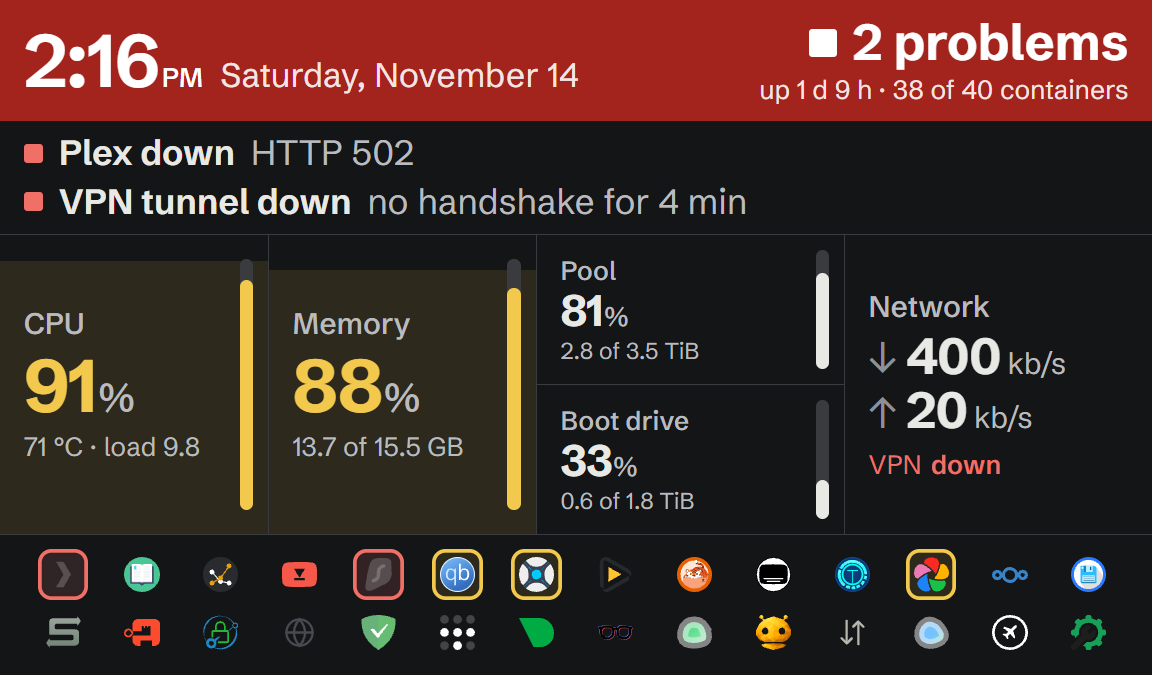 The same page at the tablet’s 1024x600, with faked data to show a bad day: Plex and the VPN down (red outlines), three slow apps (yellow), CPU and memory running hot.
The tablet can’t run Tailscale, so Caddy serves the dash read-only on a LAN-only port, and both the firewall and Caddy allow only the tablet. It’s plain HTTP because Android 7 doesn’t have the current Let’s Encrypt root cert. No HTTPS also means no screen wake lock, so the tablet relies on “Stay awake while charging”. Remember that setting, it comes back.
The tablet rabbit hole
With under a gig of RAM, Android 7 kills the browser (Fennec from F-Droid) whenever it feels like it, and it won’t relaunch it by itself. Fully Kiosk was out because on this ROM it’s stuck on WebView 100 and restart-after-crash is a paid feature.
Version one was Zion babysitting the tablet over ADB (only Zion’s key is accepted). A timer on Zion ran every minute: wake the screen, bring Fennec back, set the backlight from a sunrise/sunset calculation since there’s no light sensor, and tap the page into full screen. A page can’t go full screen without a tap, so the page reports its full screen state with every poll and Zion taps when it’s false.
On Nov 5 I found it stuck on the Developer options screen. The watchdog had been failing silently for two days. The tablet’s adbd had run out of file descriptors and refused every command, while adb get-state still happily said “device”. Turns out every adb connect leaks a socket in this adbd, even when you’re already connected (5 connects took it from 55 to 60 open files). Connecting every minute meant ~1000 sockets in ~17 hours, then the 1024 limit. Fix: only connect when the tablet isn’t already listed, and restart adbd past 500 open files. During that recovery “Stay awake while charging” got reset, so the screen timed out to the PIN lock. The watchdog puts that setting back now too.
Then on Nov 7 Zion did its 4:30am reboot for a kernel update, and the tablet’s adbd answered “offline” until I toggled ADB over network by hand. Later that day Zion’s IP changed while I sorted out a DHCP reservation, and it went “offline” again.
The cause: this adbd serves one host session at a time. While one is open it accepts every other connection and never reads it (hence the leak). When Zion vanishes mid-session, the tablet keeps that session “established” forever because there’s no keepalive, and every new connect gets ignored.
The fix: the tablet watches itself
Every recovery depended on ADB working, so the watchdog moved onto the tablet. It’s a shell script that init starts as root at boot from an .rc file (this ROM is a userdebug build with SELinux permissive, so that’s allowed). Every 30 seconds it keeps “Stay awake while charging” on, wakes the screen, sets day or night brightness, restarts adbd before the leak gets near 1024 files or when one host session has been open 30 minutes (Zion’s real sessions last seconds), and brings Fennec back if it got killed or the page stopped polling Zion. Reopening adds a fresh ?r=<timestamp> to the URL, because otherwise Fennec keeps an old “Unable to connect” page from while Zion was down.
I force-stopped Fennec and the page was polling again in ~40 seconds, and ADB wasn’t involved at all. For the stale session I tested with a 2.5 minute limit by dropping Zion’s packets: got “offline”, the tablet restarted adbd, Zion reconnected.
Zion is just an observer now. It taps the page back into full screen when needed, falls back to the old ADB nudging if the page has been gone 5 minutes, and shows a failed unit on the dash if that fails too.
And then today it ran flat while plugged in, dropping ~4% an hour while “charging”. The charger reads ~4.72 V and can’t keep up with full brightness, Wi-Fi and Fennec around the clock. Day brightness went from 255 to 150 for now. Next up: a 2A adapter with a short cable, battery level on the dash, and turning ADB over network on at boot, because after the cold boot it was off again. This tablet, man.
Built with a lot of AI help
The dashboard and the tablet watchdog were built with a lot of help from Claude and other AI agents. They wrote most of the code, did a lot of the measuring (counting adbd’s open files, timing recoveries) and kept the log in my repo. They got stuff wrong too: the first guess at the socket leak was wrong, and one agent’s “fix” for the offline tablet was to check every 5 minutes instead of every minute, which only made recovery 5x slower. I decided what the screen should show, picked and rejected designs (RIP the CPU bars), tested on the actual tablet on my actual wall, and checked everything that went in.
What’s on your homelab’s wall? And if you’ve kept an ancient Android tablet alive as a kiosk, how did you stop it from killing the browser? There has to be a less cursed way than an init script lol.
Keep reading
Raspberry Pi 2 - Model B 1GB | All you need to know
Planning to buy a Raspberry Pi 2? Or have a spare one lying around? This is the Wiki post for you. Learn how to set it up & make interesting DIY projects.
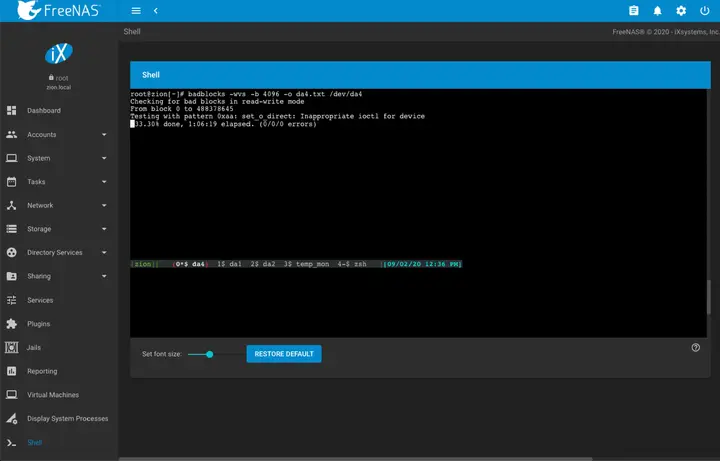
My new hard drive ritual: badblocks, TLER and the SMR check
What a new hard drive goes through before it joins my NAS: a badblocks burn-in in tmux, TLER via smartctl, and the CMR, SMR and shucking checks.
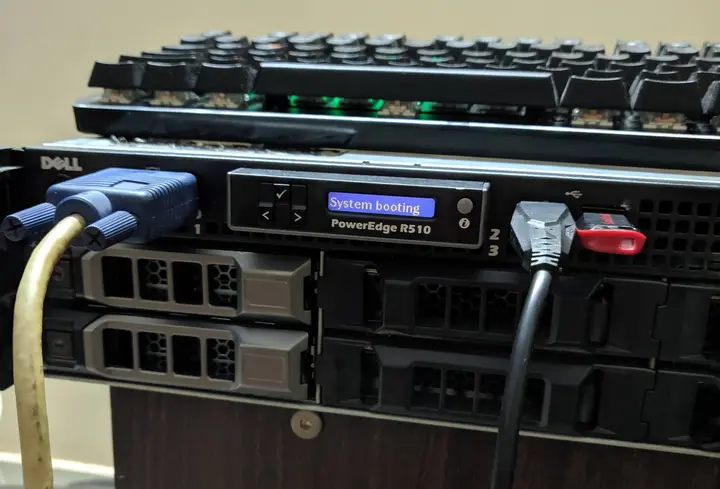
A rack server with no rack: my Dell PowerEdge R510
Two Xeon X5675s, 64 GB of ECC RAM, a PERC H310 crossflashed to IT mode and a CRT for a console. My first month with a Dell R510.
Leave a comment